Wednesday, March 11, 2009
Pick Your Spots Carefully
BLL is an example of a bearish breakout that is retracing and is providing an entry point for a short position. I entered this trade on the breakout, but the current price also provides a good entry point. Key to this is the area of support it found late last week/early this week around $37. If it breaks through this area the stock could be in for very nice run down. Conversely, you know you are wrong on the trade if it breaks above new resistance (or previous support from the wedge) at around 39-40 dollar level. The risk reward in this case is about $2 risk to $6 profit. Very nice bet that myself and any casino would take anytime.
Finally, DNR provides a bullish case where a previoud breakout seems to be ready to pull back just a tad to provide a good entry point. $14 had been behaving as strong resistance dating back to October. As the stock eventually formed an ascending triangle and broke out on the 10'th. Now it looks to be ready to pull back and retest $14 as new support. A retest would provide a very good entry point for a likely run up to $18 (based on the ascending triangle). $18 also has acted as support/resistance in the past (dating back to at least a 3 year chart). You know you are wrong here if the stock falls and holds below $14 so I am going to set my stop just above $13. That is $1 risk for $4 profit potential. A nice profit:risk ratio.
Thursday, February 26, 2009
INTC and GE
This is a lot more evident when looking the weekly chart. The range bound stock has a target of at least $19 over a longer time horizon. A break above 19 means it will return to the trading range it once held in the $20's. Again, this is why i dont invest, i trade. It is because it becomes more and more difficult to determine price targets, and relies more on fundamental analysis (which I dont really do) and less on technicals (which is my bread-and-butter).
As for GE, this stock is a train wreck. It is in a long term downtrend with no signs of slowing up. There have also been a lot of false bottoms, or kickback rallies, on the way down, making me even less trustful of any "bottom" that may form in the stock. Even though it is at $8 (down from a 3 year high of $42), there is nothing to say that it wont keep going. I do know this stock has been having a lot of problems with bad earnings and the like. So until those start to come back, and a low has been tested several times, I would stear clear of GE.
Hopefully I can have my video problems fixed soon. But in the meantime, keep your eye on GME(enter if it holds above 28.50), GENZ (nearing both horizontal and diagonal support, play the bounce), BIG (long play but earnings are next week), AOC(long at $39.5 or short at $38), PNRA(descending triangle), CRM (descending triangle), plus more bearish flags than I can count.
Monday, February 23, 2009
Next Video coming soon
Monday, February 16, 2009
Thursday, February 12, 2009
RIO
Tuesday, February 10, 2009
Need a Stimulus for the Stimulus
Monday, February 9, 2009
A Turning Point In the Market
Friday, February 6, 2009
TGIF
Thursday, February 5, 2009
Covered Calls And Spreads
The reason I trade the nearest out of the money option is because I want to leave myself room incase what I perceived to be a higher high is just a hitch in yet a larger movement. In this case, the 30 call would have given me just over $2 of reaction time should the stock move higher and I wish to hold onto my position. Plus, options near the money have the highest time value, which is what I am trying to lock in. The reason for selecting the nearest month is because time decay occurs at the highest rate in the final month of expiration. So not only will the option lose value as the stock declines, but it will lose value as the month wears on.
The major difference between a covered call and a debit spread creation is that in a covered call you own the stock where as in the spread you own a lower priced call. In the trade above I locked in a profit of $60 per option that can be deducted from the total price of the long position. This may not sound like much. If i bought 100 shares at the break out above 24 on 1/23/09, i would have spent roughly $2400. In effect I am reducing the total price to $2340 by the end of this trade. Conversely, if I had bought the $25 call upon the breakout, I would have spent about $2.50 per share, or $250 per contract. In this case, I would be significantly lowering the total per contract price of the initial call position (2.5-.6=1.9 and 2.5-1.9/2.5 = .24 or 24% reduction in total cost per long contract.) I have indicated with the big blue arrow where the call should have been sold, and indicated with the big red arrow where it should have been rebought to close the trade. .
EQ
Wednesday, February 4, 2009
Market Review
PCU
Tuesday, February 3, 2009
Early morning action
Closed out of AOC on todays open. at 38.72. Took a loss on this one.
Monday, February 2, 2009
Market outlook
January Review
My single long position is in EQ. This stock appears to be setting up in an ascending triangle formation. This stock also represents one of my larger positions in my actual portfolio, so I am definitely in position in anticipation of a breakout. My stop is held pretty tight for this with a plan in place to re-enter incase my stop is to tight.
Other longs that I looked at but did not enter include EGOV, ABX, ABAX, MCK. These all worked out. EGOV broke out today, but i was busy at work so i missed the boat. ABX and ABAX I could not get in at a price that I liked, so I just stayed out. MCK gapped up the morning that I put it on my watchlist, so i never entered. No problem there, i can always get in later if i still like the stocks. We will see. I would like to mention, that MCK appears to be setting up in a bull flag pattern, and ABAX has a very nice nice looking pole forming, and I am anticipating a bull flag formation in this stock as well.
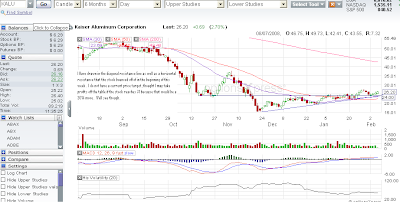
Stocks I may buy tomorrow include:BTU (ascending triangle), CAH (trending), DRQ (trending), GENZ (ascending triangle), KALU(trending-found through OA), MCK (bull flag), MHS (bull flag), OCR, RIO
I wont put on any more shorts for the moment since i a little more short exposed than I prefer. But like I said before, i expect to be closed out of some of these in the near future.
Happy Trading
Friday, January 30, 2009
Additional Trades
Target is 31. Margin is $11121.
Shorting PCU at 13.80. Stop at 15.10. Max position of 1500. Shorting 1500. Target is $9. Margin $4131
Shorting LNCR at 24.05. Stop at 25.5. Max position 1300. Shorting 1300. Target is 21. Margin $6253
Longs to watch: AYE, BTU, CAH, DRQ, EGOV, OCR
Shorts to watch: CELG, CXO, DNA,
Early Trades
Thursday, January 29, 2009
Two trades to watch
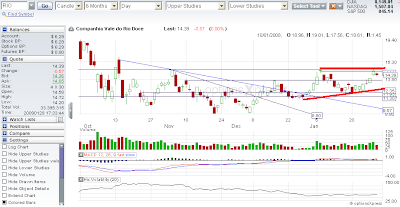
Rio is another stock that just hit resistance yesterday and is looking to come down to support. I have emphasized what I am seeing with big bold Red lines on the chart. Resistance is sitting around 15. Support is rising. I am anticipating a bounce off the trendline support, setting up a nice ascending triangle pattern. I will take a premature position at support (I anticipate to be right around 12.75) and will keep my stop tight incase it falls through. The upside potential based on this pattern is 19. I am expecting this pattern to hit bottom and begin reversing end of next week to early the following week.
Other chart less stocks i like:
Longs: ABX (trendline bounce today), ARO (buying on pullback to trendline), CAH (trending), EGOV (ascending triangle), OCR (trending)
Short: ADBE (trendline bounce today), CELG (ready to bounce down), CRS (head and shoulders)
PNRA (resistance bounce)
On a 30 minute chart of the S&P500 these support levels can be seen much more clearly. Resistance levels on the other hand occur at 855 then stronger resistance at 880 where yesterday's high hit its head and rebounded.
The NASDAQ looks much the same on both the daily and 30 minute charts.
Down to one
Tuesday, January 27, 2009
Stocks From the watch list
Longs: ASEI (hitting horizontal resistance), CAH (trendline bounce), CPLA (ascending triangle), DRQ (new 2 month high),GHDX (bull flag),MCK (trendline bounce), GME (ascending triangle)
SHORTs: PG, SAM, AOC, PSYS(descending triangle), FAST (descending triangle)
To be fair, when i first made my watchlist, i was primarily looking for bullish stocks, so the list is disproportionately represented by stocks that may be predisposed to going higher. Also, many short candidates are trading below $5 which is a price level i generally avoid. The number of shares I would need to short in order to generate good %profit would be to large.
Premarket buzz
Monday, January 26, 2009
Raise em Up
Friday, January 23, 2009
New Positions
I Love It
Major indices quickly approached all of the key support levels that I layed out yesterday. They remain in this area, so we'll see what the day brings. As I already said, if support doesnt hold, it could be another emotion and wild ride down to the lows in november. Im talking about the heads on CNBC screaming for mercy, and crying out the end of the financial world. They can be so entertaining when they panic like that. LOL!!!
Cheers.
Thursday, January 22, 2009
Support Holds
How Bout a Bearish Position
This stock recently broke down from a Head-and-shoulders pattern on 1/13, and has moved back up to retest resistance around the $47.75 level. The play on this is to sell the stock short, (although i usually use puts to play the market short). However for simplicity sake i will stay with the stock only. The stop is set to $49.01 with a price target of $39 based on the pattern breakout. I will take a position early morning sometime after 10:00 est. 1280 is the max number of shares that i can short. Assuming a 20% margin for the short side as well, with a position of 1000 shorted shares is $9600 set aside for margin purposes. To make this techinical pattern more ideal, the estimated $8-9 move is about 20% of the stock price. I have found, as have many others, that %20 moves seem to be very regular healthy ranges of movement.
Wednesday, January 21, 2009
BTU is in an uptrend and is at the trend line currently making it a good entry point tomorrow in the morning. Stop is at 22.75. Target is 29 with the next resistance level after that at around 36. This stock could provide a couple of good swing trades in the near future.
BVN has a formation much like BTU. Both are energy stocks so its no surprise. Current target is 20 with a stop at 14.90.
EQ and TTI are much the same as BTU and BVN. Both are in short term uptrends and are bouncing off of diagonal support. Ideal entry would have been the end of the day today, but early morning entry after 10:00 may also provide another decent entry opportunity. Embarq has a price target right now of 40, with 43 being the next resistance after that. Exit at close below 35.25. TTI is very similar. The next two resistance lines are at 6 and 7 with an stop at 4.60. Again, ideal entry was today but tomorrow between 10 and noon may also provide a relatively good entry price.
First Positions
Trading Rules
Before Entry:
1. Identify the direction of the stock and why it is going in that direction. Is the stock trending, or is it a pattern breakout.
2. Determine the stop loss at which the position will be exited if the trade goes against the anticipated move.
3. Determine the expected price target based on pattern breakout.
4. Take half the position off the table if the stock reaches the price target. Additionally, adjust the stop out point (a trailing stop).
5. For reversal patterns like head and shoulders or double tops, take the position in anticipation of the breakout, with the stop at or just past the shoulder hieght.
6. For continuation patterns, enter at end of day following a breakout but only as long as the breakout is sustained.
7. For trending uptrending stocks, determine the diagonal support, (or diagonal resistance for downtrending stocks). This will behave as both the entry and exit point of the trade. Enter when the stock is at or near the support on the trend side. Exit is placed just below the support.
8. Maximum position size is that at which 2% of the account will be lost upon being stopped out. Most continuation patterns will be entered half before the breakout and half at the break.
9. Scale out proceedure is used for stocks that are profitable where half the position is exited upon reaching the price target, and the other half held until stopped out by the trailing stop. Additionally, the have out position can be reentered upon a stock bounce in favor of the position.
10. Market outlook is important to determine ratio of position types Long:short. For Bullish markets, the ratio of long to shorts is to be 2:1. Bearish markets the ratio of long to short is 1:2. Neutral markets the ratio is 1:1.