Friday, January 30, 2009
Additional Trades
Target is 31. Margin is $11121.
Shorting PCU at 13.80. Stop at 15.10. Max position of 1500. Shorting 1500. Target is $9. Margin $4131
Shorting LNCR at 24.05. Stop at 25.5. Max position 1300. Shorting 1300. Target is 21. Margin $6253
Longs to watch: AYE, BTU, CAH, DRQ, EGOV, OCR
Shorts to watch: CELG, CXO, DNA,
Early Trades
Thursday, January 29, 2009
Two trades to watch

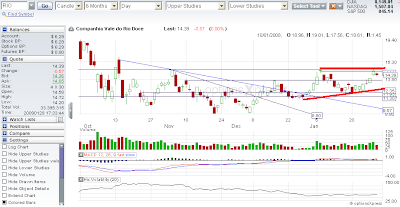
Rio is another stock that just hit resistance yesterday and is looking to come down to support. I have emphasized what I am seeing with big bold Red lines on the chart. Resistance is sitting around 15. Support is rising. I am anticipating a bounce off the trendline support, setting up a nice ascending triangle pattern. I will take a premature position at support (I anticipate to be right around 12.75) and will keep my stop tight incase it falls through. The upside potential based on this pattern is 19. I am expecting this pattern to hit bottom and begin reversing end of next week to early the following week.

Longs: ABX (trendline bounce today), ARO (buying on pullback to trendline), CAH (trending), EGOV (ascending triangle), OCR (trending)
Short: ADBE (trendline bounce today), CELG (ready to bounce down), CRS (head and shoulders)
PNRA (resistance bounce)
 On a 30 minute chart of the S&P500 these support levels can be seen much more clearly. Resistance levels on the other hand occur at 855 then stronger resistance at 880 where yesterday's high hit its head and rebounded.
The NASDAQ looks much the same on both the daily and 30 minute charts.
 The major difference is that the NASDAQ is holding at support levels at 1507 that correspond with the support found at 855 on the S&P. Not quite sure what the significance of this is yet (if it even is significant) but it certainly illustrates the slight disconnect in price movement between the two indices. Other support levels on the NASDAQ are located at 1490 (the equivalent of the 855 level in the S&P) and at 1440 where the most recent lowest low occured on the last downswing in the index. I think all indexes will kind of stumble roughly sideways until the end of next week.
Down to one
Tuesday, January 27, 2009
Stocks From the watch list
Longs: ASEI (hitting horizontal resistance), CAH (trendline bounce), CPLA (ascending triangle), DRQ (new 2 month high),GHDX (bull flag),MCK (trendline bounce), GME (ascending triangle)
SHORTs: PG, SAM, AOC, PSYS(descending triangle), FAST (descending triangle)
To be fair, when i first made my watchlist, i was primarily looking for bullish stocks, so the list is disproportionately represented by stocks that may be predisposed to going higher. Also, many short candidates are trading below $5 which is a price level i generally avoid. The number of shares I would need to short in order to generate good %profit would be to large.
Premarket buzz
Monday, January 26, 2009
Raise em Up
Friday, January 23, 2009
New Positions
I Love It
Major indices quickly approached all of the key support levels that I layed out yesterday. They remain in this area, so we'll see what the day brings. As I already said, if support doesnt hold, it could be another emotion and wild ride down to the lows in november. Im talking about the heads on CNBC screaming for mercy, and crying out the end of the financial world. They can be so entertaining when they panic like that. LOL!!!
Cheers.
Thursday, January 22, 2009
Support Holds


How Bout a Bearish Position

This stock recently broke down from a Head-and-shoulders pattern on 1/13, and has moved back up to retest resistance around the $47.75 level. The play on this is to sell the stock short, (although i usually use puts to play the market short). However for simplicity sake i will stay with the stock only. The stop is set to $49.01 with a price target of $39 based on the pattern breakout. I will take a position early morning sometime after 10:00 est. 1280 is the max number of shares that i can short. Assuming a 20% margin for the short side as well, with a position of 1000 shorted shares is $9600 set aside for margin purposes. To make this techinical pattern more ideal, the estimated $8-9 move is about 20% of the stock price. I have found, as have many others, that %20 moves seem to be very regular healthy ranges of movement.
Wednesday, January 21, 2009

BTU is in an uptrend and is at the trend line currently making it a good entry point tomorrow in the morning. Stop is at 22.75. Target is 29 with the next resistance level after that at around 36. This stock could provide a couple of good swing trades in the near future.
 BVN has a formation much like BTU. Both are energy stocks so its no surprise. Current target is 20 with a stop at 14.90.

EQ and TTI are much the same as BTU and BVN. Both are in short term uptrends and are bouncing off of diagonal support. Ideal entry would have been the end of the day today, but early morning entry after 10:00 may also provide another decent entry opportunity. Embarq has a price target right now of 40, with 43 being the next resistance after that. Exit at close below 35.25. TTI is very similar. The next two resistance lines are at 6 and 7 with an stop at 4.60. Again, ideal entry was today but tomorrow between 10 and noon may also provide a relatively good entry price.
First Positions

Trading Rules
Before Entry:
1. Identify the direction of the stock and why it is going in that direction. Is the stock trending, or is it a pattern breakout.
2. Determine the stop loss at which the position will be exited if the trade goes against the anticipated move.
3. Determine the expected price target based on pattern breakout.
4. Take half the position off the table if the stock reaches the price target. Additionally, adjust the stop out point (a trailing stop).
5. For reversal patterns like head and shoulders or double tops, take the position in anticipation of the breakout, with the stop at or just past the shoulder hieght.
6. For continuation patterns, enter at end of day following a breakout but only as long as the breakout is sustained.
7. For trending uptrending stocks, determine the diagonal support, (or diagonal resistance for downtrending stocks). This will behave as both the entry and exit point of the trade. Enter when the stock is at or near the support on the trend side. Exit is placed just below the support.
8. Maximum position size is that at which 2% of the account will be lost upon being stopped out. Most continuation patterns will be entered half before the breakout and half at the break.
9. Scale out proceedure is used for stocks that are profitable where half the position is exited upon reaching the price target, and the other half held until stopped out by the trailing stop. Additionally, the have out position can be reentered upon a stock bounce in favor of the position.
10. Market outlook is important to determine ratio of position types Long:short. For Bullish markets, the ratio of long to shorts is to be 2:1. Bearish markets the ratio of long to short is 1:2. Neutral markets the ratio is 1:1.

